S&P Global Stock Breakdown

Get smarter on investing, business, and personal finance in 5 minutes.
Stock Breakdown
You’re probably getting bored of the story by now.
A business has been around for decades, has strong financials, and no signs of disruption weighing on the product…
But AI is going to disrupt them somehow.
Rather than think through what the actual disruption would be,
A whole slew of companies have been thrown out in the stock market sell off.
S&P Global, a company that is typically held up as a hallmark of company with strong moats, is but another casualty.
How accurate is the markets assessment of their AI risk though?
Their credit rating business is regulatory protected and also benefits from network effects.
Their index business is proprietary IP.
But now people are worried about the data business?
I thought data was supposed to be king and feed AI?
But, nevertheless, though S&P Global is down -25% in just a month because of the ever present AI risk.
Well maybe there is something to this though…
Their “Market Intelligence” business uses human labor to scrap a lot of data that is in public filings.
And their Capital IQ plug in that provides data could be irrelevant if new AI agents are able to gather and populate data on the users behalf.
They talk about having a lot of proprietary data, but a good portion of that is data that is “transformed” from unstructured to clean structured data…
AI is particularly good at this.
Then there is also the seat issue—more AI doing the work, means less potential users to sell subscriptions to.
And what if credit analysts can lean on AI to the point they feel more comfortable buying debt without a rating?
If everyone has their own in-house super credit analyst with AI, then why pay the premium needed for just a mark of approval?
In this edition of Five Minute Money we explore these AI questions, but also analyze the S&P Global business to see if it could present an interesting opportunity for investors.
Segments.
S&P operates through 5 segments, which (unfortunately) each have another 3-5 subsegments.
We will briefly go through all of them below so an investor can get a better sense of the business and where the risk could lie.
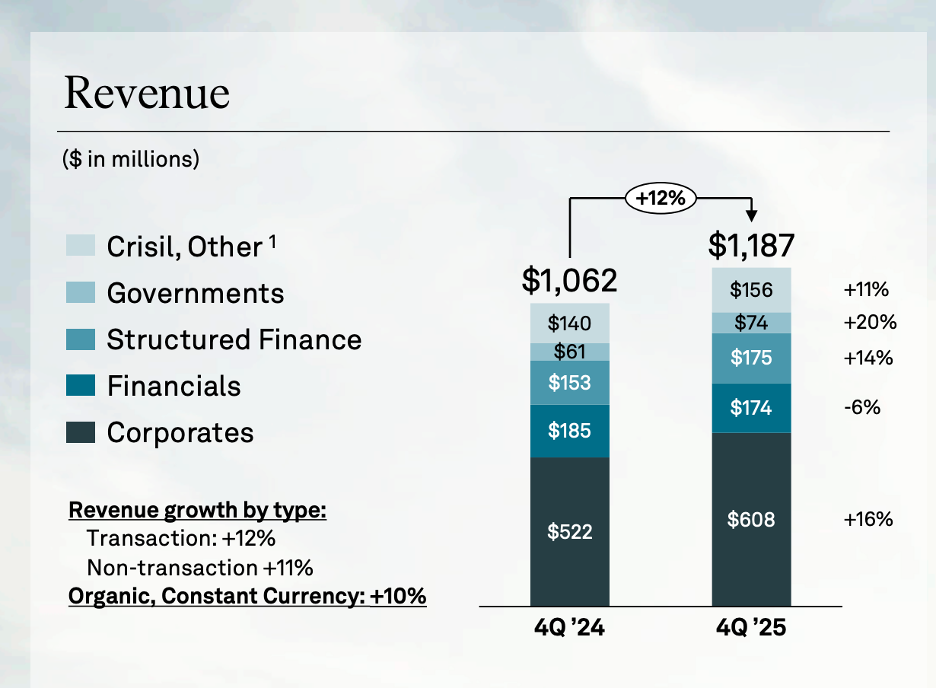
1) Ratings
The first segment is their largest, it is the Ratings business.
This segment constitutes $3 billion in operating profits, which 46% of the total.
This segment (together with the indices business) are their highest quality segments.
They have two products here: Credit ratings and Ratings360, which is their platform that lets users pull ratings and other research.
The credit ratings business essentially involves rating debt.
The stated reason why this business exists to help investors know which debt is at a higher risk of default.
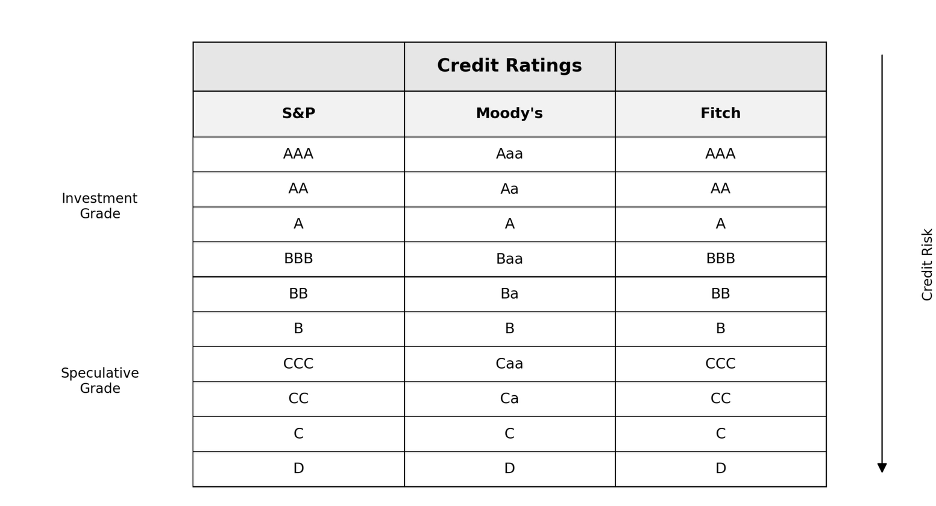
They will rate the best credits AAA and then it goes down from there to AA+, AA, AA-, A+, A, A-, BBB+, etc.
Anything that is rating BBB or higher is considered investment grade. Anything below is colloquially called “junk bonds”.
Now you may be thinking, isn’t it easy to analyze a debt security and tell what bonds are at risk of default? Why do you need S&P Global?
Well you are right.
The real reason this business exist is basically so funds and investors can “cover their a**”.
If a bond is rated investment grade and ends up in default, the investor (endowments, fund managers, etc.) can say “well we only bought S&P Global Investment grade!
In fact, there are many funds that are mandated to ONLY buy investment grade bonds.
And if they happen to default, it gives them some coverage to protect their career and also allows them to say they followed their fiduciary duty.
Yes, it is a little cynical.
However, the truth is that if a bond isn’t graded investment grade by usually at least 2 of the big three (S&P Global, Moody's, and Fitch) then that bond is likely to face a higher interest cost.
Because these three credit agencies are the largest and have the best brands (S&P Global and Moody’s in particular), most issuers of debt want them to rate it.
If they get a high rating, then they can go to the markets and sell their debt at a lower cost (read lower effective interest rate).
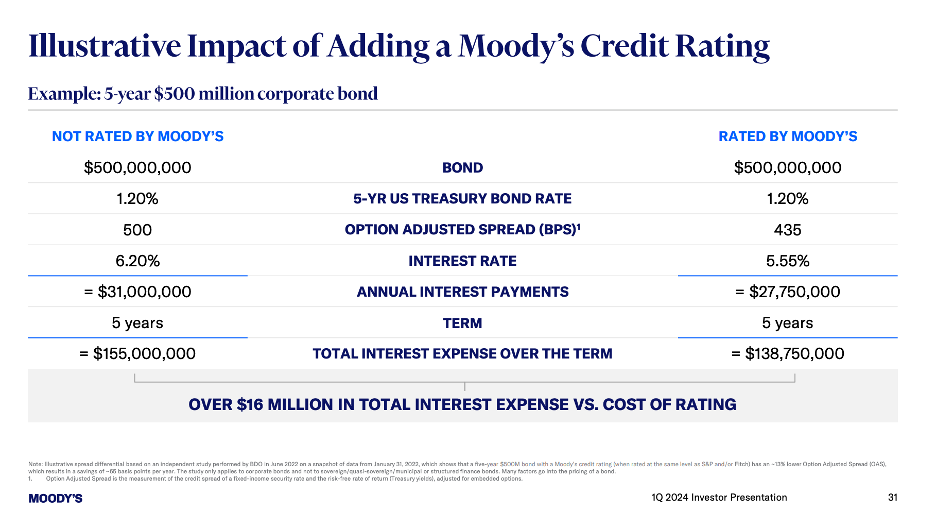
This slide below from Moody’s shows how a rating by Moody’s (it’s the same for S&P Global), can save the issuer $16 million over the term of the loan.
So because everyone in finance basically looks for these ratings by Moody’s and S&P Global (Fitch is a distant 3rd), then the debt issuer wants them to lower their cost.
The investors want them because it is either mandated by a fund or endowment to only buy a certain grade of bond and also because it can give them “career insurance” in case something goes wrong.
S&P Global typically charges around 7bps of the issuance amount for corporate bonds (although there is a range and it can be negotiated)
Structured debt cost more and municipalities are usually charged less.
In addition to this fee, they are charged “Monitoring Fees” to continue to update the credit rating.
All of these fees are charged to the issuer and included in the issuer's cost of borrowing.
Since it is still cheaper to get the S&P Global rating and pay the 7bps then go without it, most corporates basically have to get the ratings (it be financially silly to not).
This business is a bit cyclical, though, because it is tied to global debt issuances.
And as you can imagine, more debt is issued when interest rates are lower than higher.
In 2021 for instance, when interest rate fell to near 0%, this business boomed and generated $2.6 billion in operating profits.
A year later, in 2022, it fell to $1.7 billion.
That was an extreme example, but does show how this business can vary from year to year.
There is little risk AI can replicate any of this because what they are selling isn’t the actual analysis, but a stamp of approval from S&P Global.
Which btw, is so entrenched in finance that even after they rated a lot of low quality mortgage backed security debt AAA that eventually defaulted…
They still are a gold standard and it didn’t seem to hurt their business one iota.
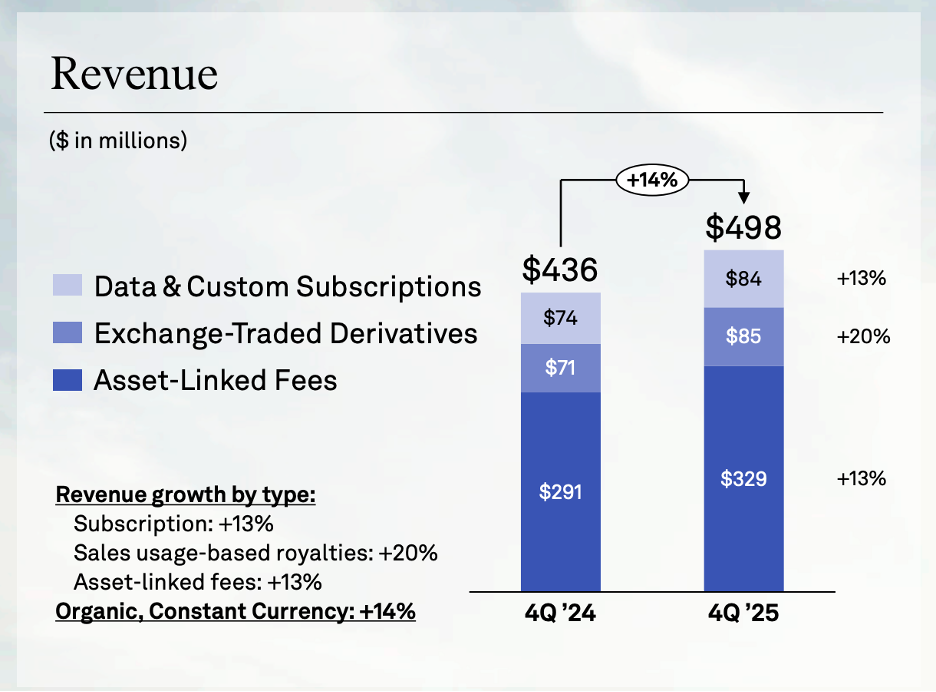
2) Indices
Indices is their second largest segment, representing $1.3 billion in operating profit or 19% of the total.
There are three sub-segments here: 1) Data & Custom Subscriptions, 2) Exchange-Traded Derivatives, and 3) Asset-Linked Fees.
As you probably surmised from S&P Global’s name, they created and own the S&P 500 index.
They also own the Dow Jones index and the Vix (volatility index) and a slew of others (S&P TSX for Canada equities, Dow Jones Sustainability Index, S&P GSCI for commodities, S&P U.S. Aggregated Bond index, etc.)
The three sub-segments are basically different ways they monetize this IP.
The data & custom subscriptions is a recurring subscription sold to asset managers, banks, analytics platforms, and anyone else who needs access to the constituents in the index, the methodologies, and APIs.
For instance, a firm may want to break down the different stocks in the S&P 500 to see which are outperforming—you need to pay them to access this data.
If you want to use the S&P 500 benchmark for performance comparison, you need to pay them for a license.
Exchange-traded derivatives are for products like Futures on the S&P 500.
They are usually paid on a per contract or volume basis here.
Asset-linked fees have to do with funds and ETFs that want to use the S&P 500 (for example) as an underlying index to allocate funds.
So you can’t actually “buy the S&P 500 index”, you buy an ETF that tracks it.
They charge a fee (think 2-4bps) on all assets that use their IP.
And when this is on trillions of assets, it adds up.
It is also very hard to replace because if someone wants to buy an S&P 500 ETF, the ETF provider needs to pay S&P.
There are a lot of products around that can try to circumvent them by creating their own indices, but the S&P 500 is index a lot of investor demand.
3) Market Intelligence
This is their third largest segment, representing $1 billion in operating profit or 15% of the total.
This is where investors tend to worry the most about the AI risk.
They have three subsegments here: 1) Data, Analytics, & Insights, 2) Enterprise Solutions, and 3) Credit & Risk Solutions.
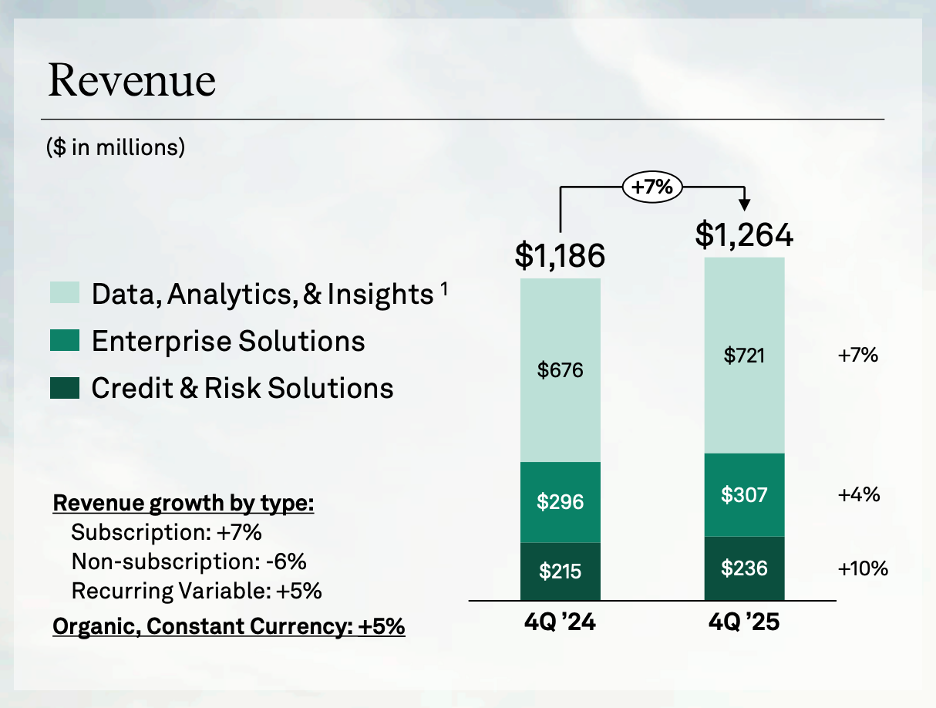
Let’s take them one by one starting with the Data, Analytics & Insights segment.
We will break this up in terms of how the data is consumed and what the data is.
The data is consumed through:
Capital IQ (usually called Cap IQ) which is a desktop app, an excel plug in, and now also include ChatIQ for a chat bot like experience.
Xpressfeed, which is a bulk data feed customers can access through various APIs or Xpresscloud where customers can access data through Snowflake’s or Datadog’s data marketplace
ChartIQ for charting their data
Markit Digital which integrates their data sets into with various financial websites or mobile apps
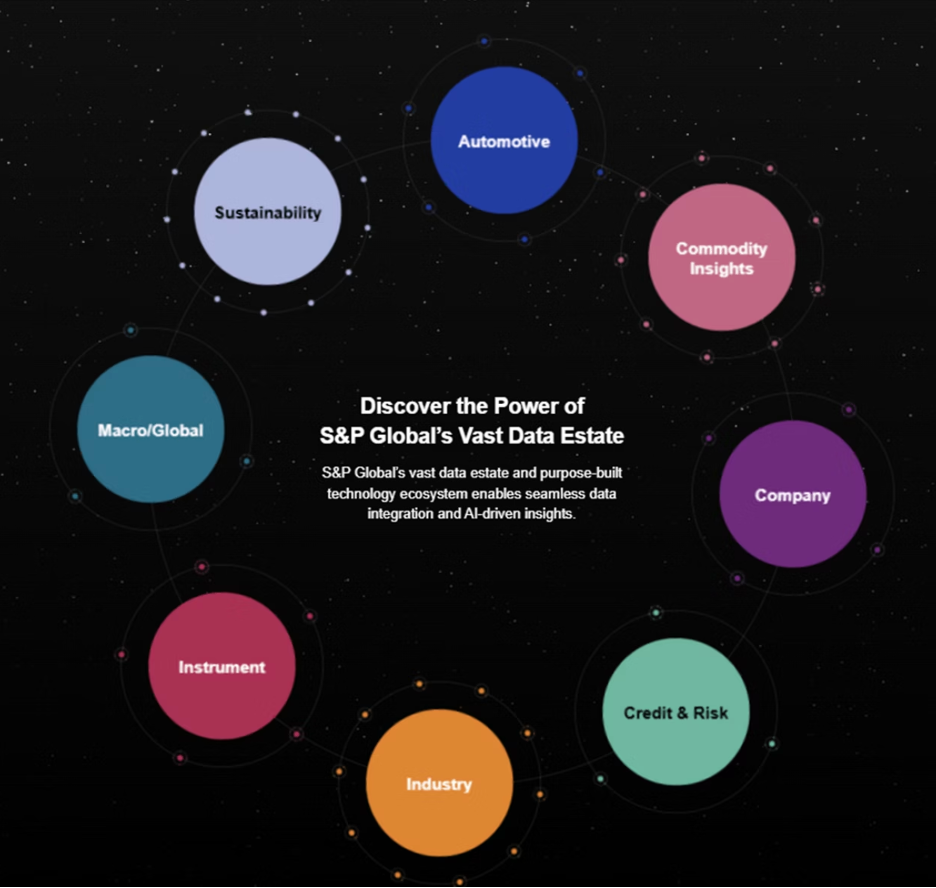
S&P Global in total has over 200 “proprietary” data feeds with another 800+ data partners that they integrate with.
Now, how hard it is to replicate some of their data sources is the key AI risk investors are worried about.
Because even though they will say almost all of their data is “proprietary”, a good portion of their data can be gathered because it is publicly available.
They have a team of thousands of workers that will pull data from publicly filing and “cleanse” it and they upload it.
Cleansing it means making sure that the SG&A for one company is equivalent to another’s. Maybe one company reports SG&A and marketing together while another breaks it out separately. Their data needs to account for this.
As you can imagine, AI can make this work much quicker and erodes the moat of needed thousands of workers to do this.
Below is one of 10 pages of their total data offerings.
We will oversimplify the offers below.
Core Fundamentals (Compustat / CIQ Financials / Point-in-Time): standardized company financial statements and histories that let you compare firms apples-to-apples (normalize line items, currencies, fiscal years) and build models without manually cleaning filings.
A lot of this data is probably the easiest to “copy”, but it is worth something still that it is the S&P name standing behind the data.
They also offer $50 to anyone who can find an error in their data, which helps ensure accuracy.
Estimates + Events (S&P Global Estimates / Key Developments): consensus forecasts, earnings, guidance, corporate actions, and notable events.
They own Visible Alpha which is one of the best sources for consensus figures. You need to get this data directly from various bank’s research departments and is not available publicly.
Entity & Classification Layer: the identity system that makes all the data usable—industry taxonomy (GICS), security/issuer mapping, ownership and holder data, and a people/relationships graph for origination and prospecting.
This data is a bit harder to scrape from publicly filings because it can be trickier when a company undergoes different M&A, name changes, and can be listed as say Apple, Apple Computers, AAPL, etc.
AI can be good enough for many use cases, but it can’t guarantee 100% accuracy.
Macro and Risk (PMI / ECR Risk Intelligence): top-down datasets that quantify the environment.
Included here are products like the S&P Global PMI (purchasing managers index) which is survey that is not publicly accessible data. They publish the composite, but not the components, which is what customers want.
ECR (Economics & Country Risk) is another product where a lot of the inputs may be public but they have their own scoring methodology that is widely used.
Vertical Data: This includes specialized data sets for industries like deposit info for banks for instance or ad rates for linear tv.
Maritime tracking, including where ships are moving to, port traffic, and trade flows (this data is often collected from ship broadcasts)
In theory, there is no reason to think AI can’t gather all of this data more efficiently, but it is unlikely to do so with near 100% accuracy.
Their clients are not interested if there is any risk of hallucination in the data gathering.
Enterprise Solutions (sub-segment of Market Intelligence)
This includes corporate actions & securities processing, enterprise data management (EDM/golden source), reconciliations, and other operational workflows that sit inside a bank’s back office and are painful to rip out.
ClearPar for syndicated loans to track lender allocations, distributions, and notice events
KY3P which is “Know your 3rd party” that is platform for due diligence on vendors and counterparties
Cappitech for trade and transaction reporting for banks and asset managers
This business is pretty embedded—and importantly, trusted—by many financial institutions and corporations and is not at high AI risk.
This subsegment is 25% of this segment’s revenues.
Credit & Risk Solutions (sub-segment of Market Intelligence)
Credit & Risk Solutions turns S&P’s ratings content into workflow tools and models that investors, banks, and risk teams use to monitor and price credit risk.
Ratings distribution platforms: products like RatingsDirect/ RatingsXpress that deliver ratings, research, and surveillance updates in a usable workflow.
Credit analytics & pricing tools: model-driven risk and spread tools for default risk, relative value, and portfolio monitoring.
Risk overlays: add-ons like climate/sector risk signals and monitoring dashboards that help firms stress-test exposures and stay compliant.
AI can’t copy their ratings, but it can create credit analysis. S&P is still a standard though for investors and this tools are embedded in the workflow process. There is a low to moderate risk of AI displacement here.
We will talk more about the AI risk later on though.
4) Energy
Energy is their fourth largest segment, representing $0.9 billion in operating profit or 14% of the total.
They have 4 subsegments here: 1) Energy & Resources Data & Insights, 2) Price Assessments, 3) Upstream Data & Insights, and 4) Advisory & Transactional Services.
Energy & Resources Data & Insights (sub-segment of Energy)
ERDI is a subscription for data, research, forecasts, and analytics that commodity traders, corporates, and project financiers use to understand physical markets.
Access to commodity fundamentals (supply/demand balances, inventories, flows), news, and analytics across oil, gas/LNG, power, chemicals, metals, agriculture, and energy transition.
Planning-grade models: long-dated forecasts, cost curves, and capacity/asset databases that get plugged into corporate strategy and project finance models
This is 35% of Energy revenues.
Price Assessments (sub-segment of Energy)
Price Assessments is the Platts benchmarks that publish reference prices used across physical trade and derivatives. This is similar to how everyone quotes the S&P 500, except actual trade is conducted on the Platts references prices and it goes into legal contracts.
60% of the world's Brent crude oil is priced off of Platts Brent
Almost all major airlines price fuel off of a Platts Benchmark
Most of the world's iron ore is priced off of the Platts IODEX
This is a strong business because even if someone else could gather the same data, they can’t create a “Platts” pricing index, which is what is contractually required.
Platts is 35% of this segment's revenues.
Upstream Data & Insights (sub-segment of Energy)
Upstream Data & Insights is the “physical asset library” for oil & gas—datasets and tools used to evaluate basins, fields, projects, and fiscal terms
EDIN or Exploration and Production Information Network is platform a lot of the industry uses to access this data.
A lot of this data is hard to gather and can often involve scanning/ uploading physical copies of paper that only exist in various government offices.
This is 20% of this segment's revenues.
Advisory and Transactional Services (sub-segment of Energy)
This segment is for bespoke work, transaction advisory revenues, and they host a very popular industry conference called CERAWeek.
This is 10% of this segments revenues.
Overall the Energy segment is better insulated against the AI risk then the Market Intelligence segment given that the data involved here is generally harder to gather.
There still is some AI risk though.
5) Mobility
Mobility is their smallest segment, representing $380 million in operating profit or 6% of the total.
They are planning on spinning this segment off, but it includes various data, forecasting, and analytics to automakers, suppliers, dealers, and lenders, and they also own CARFAX.
Competition.
Competition can broadly be split in between the financial data providers and the physical data info services.
Their competitor set for financial data includes Bloomberg, Factset, and LSEG (London Stock Exchange Group) for the market intelligence group.
Bloomberg has a leg up because of their chat and live trading that almost all banks and asset managers are on. They also have very strong data sets, particularly in fixed income.
Factset competes against S&P more on the desktop business with CapIQ and the rest of the Market Intelligence Segment. Their excel plug in is more widely used than CapIQ.
LSEG acquired Reuters (now called Refinitiv) and also compete in desktop, but they are more competitive in enterprise data feeds.
In physical data info services, there are vertical specific competitors like Argus and WoodMac that compete in the price assessment and energy segment, respectively.
Now S&P covers everything from the macro forecasts, physical commodities data, pricing data, and a slew of other data streams on a single platform.
A lot of this was supported by their $44 billion IHS Markit acquisition in 2021.
This was a “transformational acquisition”.
IHS Markit.
IHS Markit acquisition was to build up their scale in their data analytics business. This was in part because the credit business was seen as too cyclical and they wanted more recurring revenue to whether that cyclicality.
They also wanted to leverage their CapIQ interface to better monetize data
However, they paid $44 billion for that right, or about 28x EBITDA. They have been able to synergize this down with cost cuts and cross-selling to perhaps 20x, but that was over 5 years.
They did acquire some stellar assets like the iBoxx and CDX/iTraxx indices for fixed income and it also allowed them to get a foothold into private markets with their iLevel software, but private markets still requires a lot more investment to make that a fuller data set…
Something they are still working on today.
The energy assets they acquired (EDIN, CERAWeek, and a lot of upstream data) are also high quality, but they paid a steep price for all of these.
The mobility segment they now have was essentially acquired in that acquisition and even though it has performed well, they don’t see it as strategic and are spinning it off.
It seemed that they were so focused on increasing the competitiveness of their data offering, they didn’t ask whether this was a business they should commit more capital too.
Now, let us clarify that these data analytics business are still vastly better quality then the average business and generally capital-light (huge asset purchase price exempted).
Still though their core credit rating, indices, and Platts business were far higher quality, so there is an element of diworsification.
Their ROIC went from 60% in 2019 to 10% LTM. This suggest that at the very least they overpaid for IHS as returns still aren’t strong 5 years later.
The general competitive landscape is that all of these data providers do one thing particularly well, have a good amount of overlap for some of the most commoditized data feeds, and then lack some other elements.
How does AI change things?
The AI Risk.
The AI risk essentially means that all of their hard work in gathering data with humans can be replicated at a far lower cost today.
However, that also means that future data gathering efforts could be cheaper for them as well.
S&P expects some margin expansion in their Market Intelligence segment as a result.
It does open up the door for potential competition, but new start ups will struggle to gain institutional trust
This is because the data needs to be 100% accurate.
This is not an area where hallucination is acceptable.
To address AI they have created two new internal structures: The Chief Client Office and the Enterprise Data Office.
Essentially, the client office is to improve cross-sell and coordination cross all of their different offerings.
The Enterprise Data Office is designed to unify all of their disparate databases that have accumulated from different acquisitions.
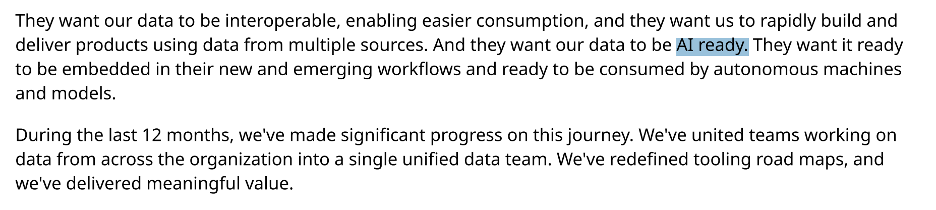
They have talked about making their data “AI ready”
They also have partnered with firms like Anthropic, Gemini, and IBM to address short comings with AI.
The general AI strategy is to integrate with various different offerings and let users decide how they want to consumer their data.
They will add AI agents to their desktop apps and have a chat app. Or if users prefer they can go to Claude and Claude can integrate with their data set.
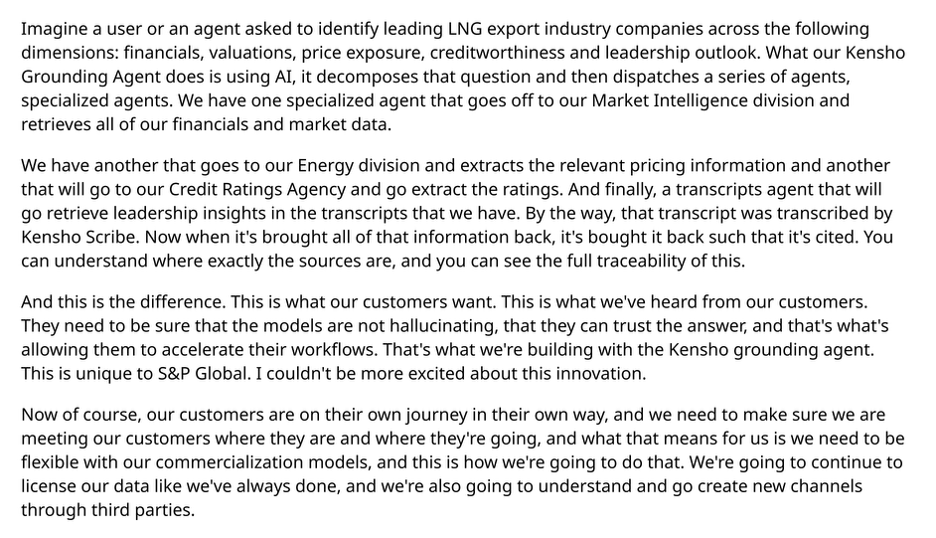
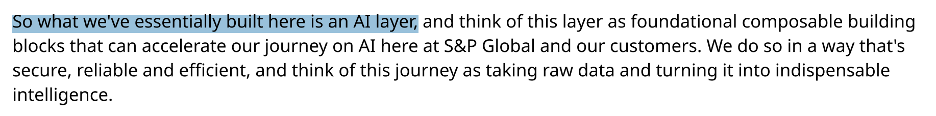
S&P also has Kensho, which was acquired in 2018 and is their internal ML/ AI division.
Kensho has better audio to text models for financial data (not confusing say GAAP with gap) and can link different businesses to their many databases.
Kensho also serves as the connector between different LLMs and S&P’s databases, so an LLM doesn’t probabilistically “guess” the revenues, but can instead retrive it.
All of this helps negate the risks of AI because ultimately, leading AI models don’t want to be in every business and have to rebuild datasets and distribution that already exists.
Besides AI driving costs cuts and increasing the value of their product, they have other opportunities in expanding out their private business data sets, ESG, and private credit ratings.
Valuation.
SPGI at a $405 stock price, has an enterprise value of $139 billion.
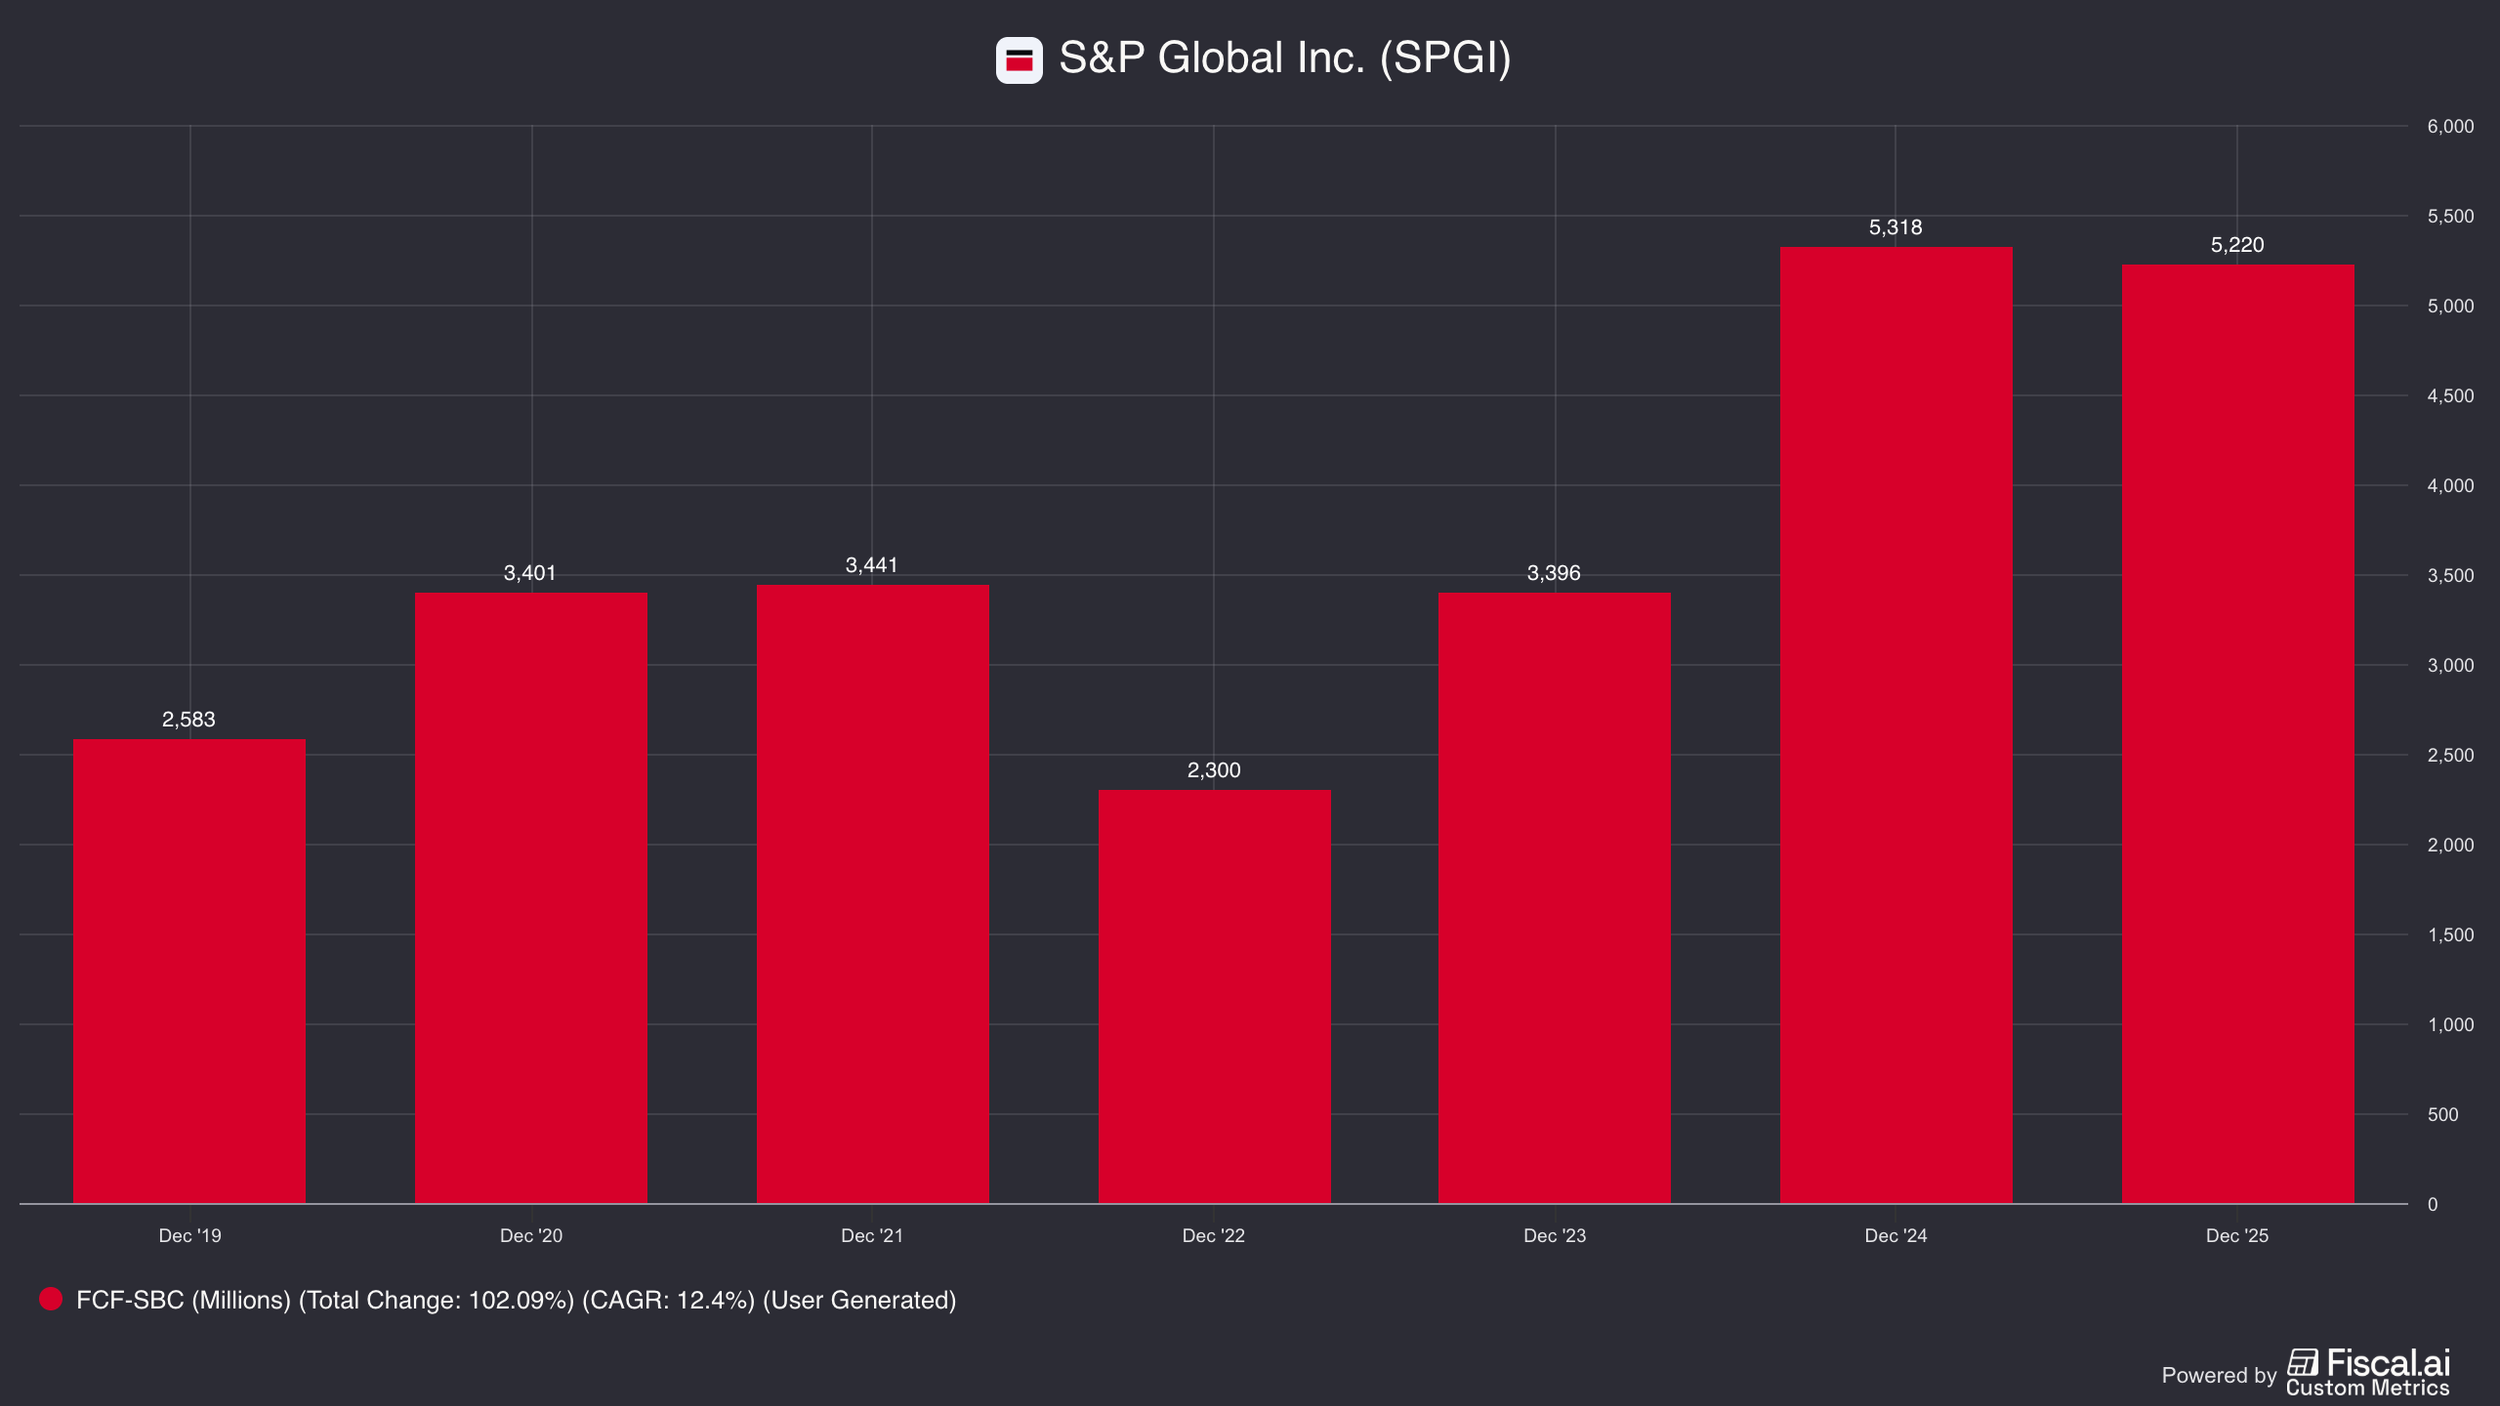
Free cash flow over the last twelve months $5.2 billion, for an EV/ FCF of 27x.
There is some volatility in earnings, particularly in credit ratings, but through an interest rate cycle it still grows peak to peak.
Right now there is less of a risk interest rates will increase (which reduces debt issuances and refinancing) then decrease.
Putting SPGI as a high single digit grower sounds fair, for which a 25-30x multiple could be a fair valuation.
This means an investor’s return would be basically the earnings growth, plus and capital they return.
Last year they bought back $5 billion in stock and paid $1.2 billion in dividends, which is a bit higher than what their cash flow will be able to sustain today. We can round it to a “shareholder yield” of 4%, which if you add a 7-9% topline growth rate to it, can be 11-13%. This could actually be a but higher with margin improvement.
This math though, assumes multiples basically stay flat.
If AI—or simple competition—weighs on their ability to raise prices or impacts how many seats they sell subscriptions too (the same issue we talked about with SaaS names like Adobe and ServiceNow) then this returns could be lower.
While there doesn’t appear to be a real existential risk AI poses S&P Global…
An investor has to decide how big of an opportunity they really think it represents.
For more on S&P Global, check out this video below.
Nothing in this newsletter is investment advice nor should be construed as such. Contributors to the newsletter may own securities discussed. Furthermore, accounts contributors advise on may also have positions in companies discussed. Please see our full disclaimers here.