How to Value Unprofitable Growth Stocks

Get smarter on investing, business, and personal finance in 5 minutes.
How do you value an unprofitable company?
Something like PE ratios don't work, and if you look at something like a price to sales metric that doesn't have any sort of sense of economics, it's agnostic of the actual profitability of the business, which is exactly the problem.
When you're looking at a growth company, there are no profits, and so what do you do?
There are 2 frameworks that we can use:
1) Fermi Problems
2) The Mature Margin Framework
These two frameworks will show you how to invest in all stages of growth companies from businesses that are pre-revenue, to businesses that have revenue but lack profit to even more mature businesses.
Fermi Problems.
Fermi problems was popularized by Enrico Fermi, who was a Manhattan Project nuclear physicist and was known to make really good estimates when they were testing the nuclear bomb.

A Fermi Problem is when you take a question and you break it down to as many constituent parts as you can, and you make assumptions around that.
For example, how many piano tuners are in Chicago?
At first, it’s a crazy question.
How would you possibly know how many piano tuners are in Chicago?
Now, the point isn't about getting the exact right answer, but it's about creating a framework of how to think about this.
Let's say you want to answer this question of how many piano tuners there are in Chicago.
Well, let's start with the population of Chicago which is about 3 million people live in Chicago.
How many households are there?
We could assume 3 people per household an on average, which gets us to 1 million households.
Now, let's say 1 in 20 households have a piano, which will be 50,000 pianos.
How many times do you need to tune a piano a year?
Let's say 1-2 times a year.
Now how many pianos can a piano tuner tune in a day?
Let’s take a low-end estimate and say a piano tuner can tune 1 piano a day.
50,000 pianos need to be tuned every single year, with an average piano tuner is tuning 1 piano a day and working five days a week.
You take the 50,000 pianos that need to be tuned and divide by 5 to get 10,000 working days a piano tuner needs to be out there tuning a piano.
Now how many piano tuners do we need?
Let’s assume people work 50 weeks a year, so will take the 10,000 working days and divide by 50 (10,000/50) to get us 200 piano tuners.
You could see how we walked through all that math to get to an answer and each individual assumption on its own doesn't seem that crazy.

But, it’s important to know that these assumptions can be really sensitive and can distort large results at the end.
The important point in this exercise is not whether the exact assumptions are correct.
Almost certainly, many of them will be wrong.
The value comes from understanding the logic chain that connects market size, adoption, pricing, costs, and ultimately earnings power.
This is what investing in emerging businesses often looks like.
We can use this framework to figure out a rough valuation for Waymo.

Waymo Fermi Analysis.
In this example, the analysis starts with the total number of miles driven annually in the United States.
With roughly 240 million licensed drivers each driving around 13,000 miles per year, that results in approximately 3.1 trillion miles driven annually.
From there, the assumptions begin layering on top of one another.
If autonomous vehicles eventually capture 25% of all miles driven, that would imply roughly 775 billion autonomous miles annually.
If Waymo were able to capture 50% market share within autonomous driving, that would result in approximately 400 billion miles driven per year on the Waymo platform.
The next step is monetization.
Assuming Waymo generates an average of $1 of revenue per mile, the business would produce roughly $400 billion in annual revenue.
Importantly, this assumption already embeds significant pricing compression relative to today’s rates, reflecting the belief that costs decline as the platform scales and autonomous rides become more broadly adopted.
Then comes the cost structure.
Assume each vehicle drives 100,000 miles annually.
To support 400 billion miles, Waymo would require approximately 4 million vehicles in operation.
If each vehicle costs $100,000 and has a usable life of 300,000 miles, the depreciation cost alone would equal roughly $0.33 per mile.
Additional operating assumptions might include:
$0.20 per mile for cleaning and maintenance
$0.15 per mile for insurance and fleet operations
$0.10 per mile for charging and energy costs
Combined, total operating costs would equal approximately $0.78 per mile.
Against $1.00 of revenue per mile, that leaves roughly $0.22 in operating profit per mile.
Applied across 400 billion annual miles, the business would generate approximately $88 billion in operating profit.
Applying a 20% tax rate results in roughly $70 billion in NOPAT.
If a business is capable of generating $70 billion in annual earnings at scale, the next question becomes what multiple those earnings deserve and what that implies about enterprise value relative to today’s expectations?
We could put a 20x earnings multiple on this which would be a valuation of $1.4 trillion.
And then we can say that we think they could achieve this in 15 years from now.
How much is it worth today?
Since these are risky assumptions, we will discount at 20%, which would get us a valuation of $90 billion today.
This was kind of close to actually the valuation they just last raised at that was $126 billion.
If I were to ask you at the outset, how much is Waymo going to be worth in 15 years, would you have really known how to begin?
Now you can see with this Fermi problem framework of just breaking things down you could really arrive at estimates for a variety of different things.
Now a big warning here is just because you can arrive at an estimate doesn't mean you should trust it, and doesn't mean you also should only do it once.
There is huge variance in a lot of these numbers that we just did in this example.
A 1 penny difference in profit per mile leads to a $3.2 billion difference in NOPAT.
If you're looking at the cost structure and you're off by 10 cents, that's a lot of money that that you're off by, right?
What I recommend when you're doing these sorts of problems is you pick the assumptions that you can have the highest confidence in that are still kind of plausible.
You want to run multiple scenarios with different outcomes.
Each new scenario creates a probabilistic distribution.
Now, you want to have high confidence in conservative assumptions.
Mature Margin Framework.
The mature margin framework is great to use when you have a company that is growing a lot, they have growth expenses.
At some point in the future when they're not growing as much, they won't need to spend that much on sales and marketing and they’re cutting down R&D, so at maturity, the company’s margin profile will look different than it does today.
Let’s take AppFolio for example.
AppFolio is a company that sells software for real estate property managers with less than 400 units.

You can look at their margins today and they have 17% EBIT margins.
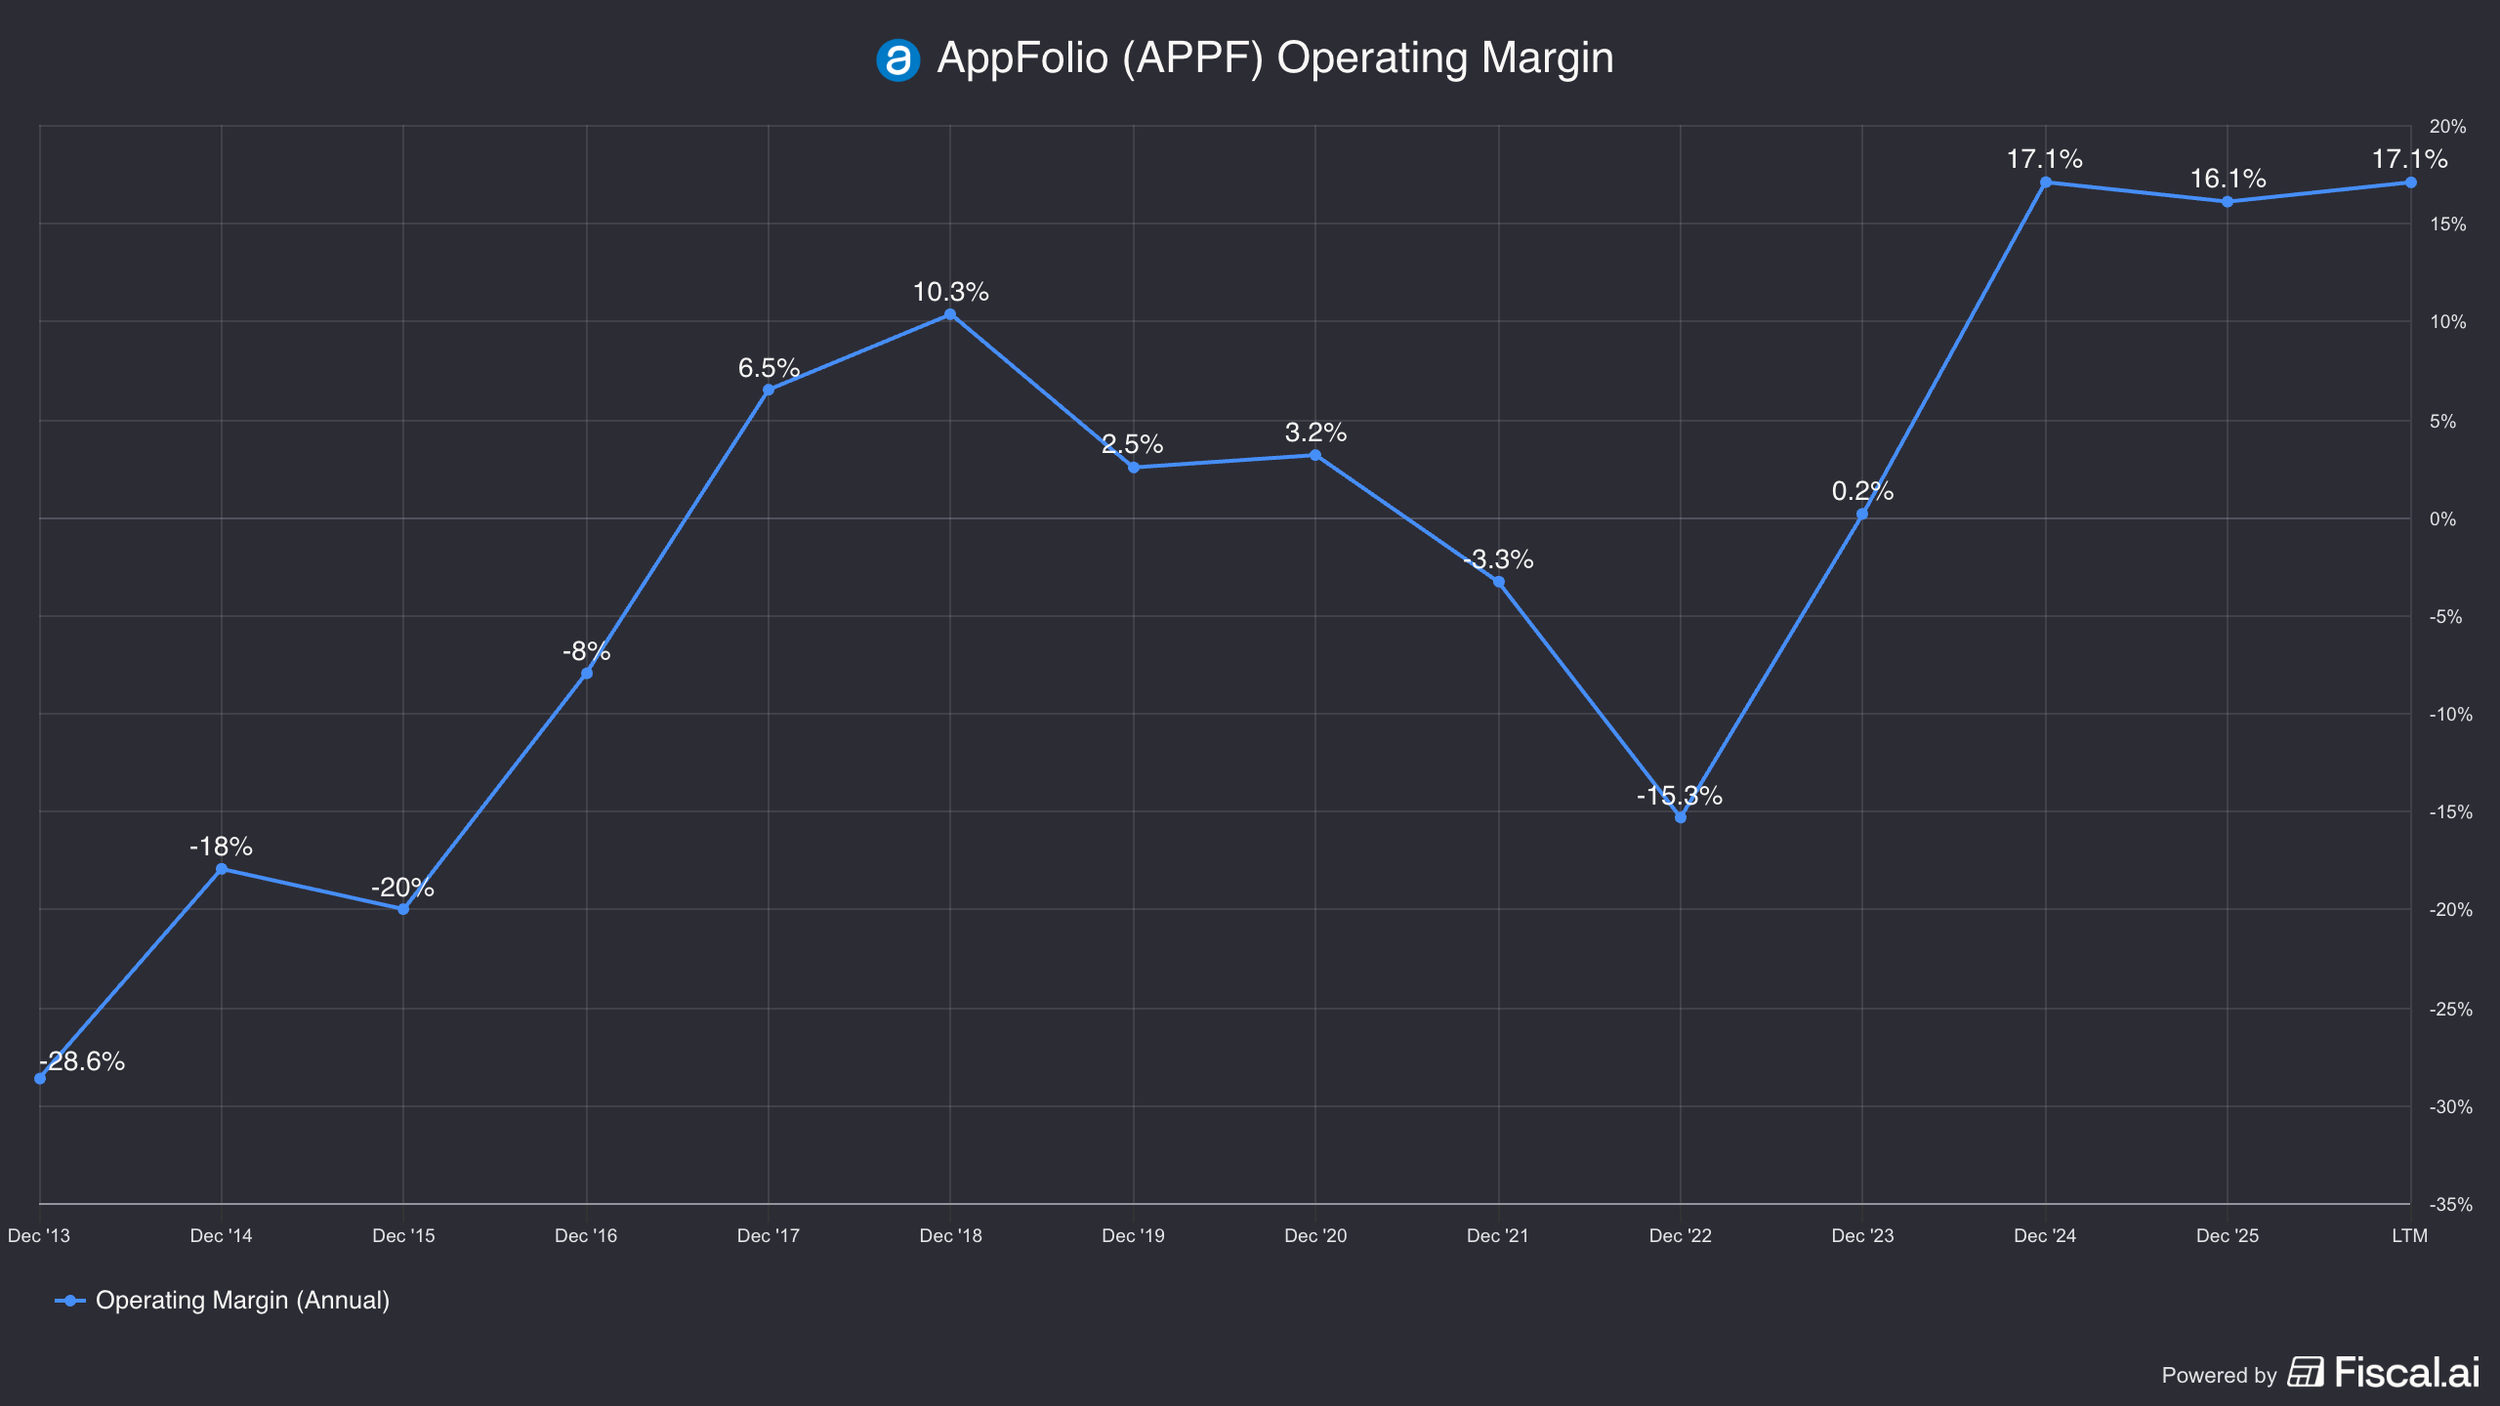
You could also though look at their S&M and R&D structure relative to other more mature players, and you could see that as they continue to grow, they're probably going to be able to get some leverage from that.
If they're not growing as much in the future, they won’t need to spend as much on marketing.
This kind of mature margin framework is very commonly applied to software companies because the idea is once you get the software company, they don't leave.
And a lot of the marketing that they're spending is not towards keeping an existing customer, but towards getting new customers.
If you want to value the business and the economics of the business, you want to strip out all that money they're spending to acquire new customers, because in theory, they could tomorrow turn off all that marketing and gush cash flow, right?
Sources of Margin Uplift.
There's two sources of margin uplift when you're doing this mature margin framework.
The first source is just going to be as a company grows and gets bigger, they're getting operating leverage on fixed costs.
For example, if you have a headquarters offices that you own, it doesn't cost them any more fixed costs for them to sell the same software to more people, right?
The second uplift to margins is once you are reaching maturity, you’re spending less money on growth so your expenses are curtailed.
Going back to AppFolio, maybe a fair range of mature margin for AppFolio is 25-35% EBIT margins.
If we take that midpoint 30% and then apply it to their revenue of $1.1 billion, and then we tax it at 20%, we get ~$265 million in NOPAT versus their current enterprise value of $6 billion.
Which gets us an earnings multiple of 22x.
Here's the key thing, if you didn't do the mature margin math and you're just valuing them off of their current earnings stream, the 17% EBIT margin they're currently doing, you would've got a 44 times earnings multiple.
That is a big difference if you're doing the mature margin framework versus not.
When you’re spending money on growth, this is going to be an expense that is not expected to go on forever.
If you put a multiple on something it’s kind of like doing a discounted cash flow on it.
You are assuming that those current growth expenses go on for the life of the business.
That is the idea behind the mature margin framework.
You need to get rid of all of these growth expenses into order to see what the company's underlying earnings power really is.
Now, there needs to be a caveat here that you have to be aware of, which is that if you are doing a mature margin framework, the multiple you get out should not be looked at the same way as a multiple of a higher growing company.
If you are in this kind of mature margin world right now where it's like, what is the company earning at maturity, then you're assuming you're not spending growth expenses.
And if you're not spending so much on growth expenses, you’re not going to be growing as much, so you should expect the mature margin multiple to be a lot less.
Now, in my example, I used a 30% mature margin for AppFolio.
That is not what I think the absolute maximum margin profile of the business could be if management decided to purely optimize for short-term cash flow.
Maybe the business could do 35% margins, or perhaps even higher, but that type of margin structure would likely come from dramatically reducing growth investments and simply “ringing the business for cash.”
In other words, the company would stop prioritizing expansion and instead focus on harvesting the existing customer base for as much cash flow as possible.
The reason I do not like using the most aggressive mature margin assumption is because I do not think most great businesses actually operate that way long term.
More importantly, if a company becomes too aggressive in extracting profits, it can weaken the durability of the business itself.
Cutting back too heavily on R&D, sales efforts, customer support, or product innovation may boost margins temporarily, but it can also reduce competitiveness and shorten the lifespan of the business.
And that matters when you think about valuation multiples.
If a company is running purely for cash flow extraction with very little reinvestment, then growth is probably going to slow significantly.
Maybe earnings only grow at low-single-digit or mid-single-digit rates from that point forward.
In that scenario, you probably should not attach a premium multiple to those earnings.
Instead of assigning something like a 25x or 30x multiple, maybe the appropriate valuation is closer to 10x–15x earnings because the business has effectively transitioned into a slower-growth cash-harvesting asset.
That is why, when I use a mature margin framework, I am not trying to estimate the absolute highest margin a company could theoretically achieve.
I am trying to estimate a realistic, sustainable margin structure that balances profitability with the long-term health of the business.
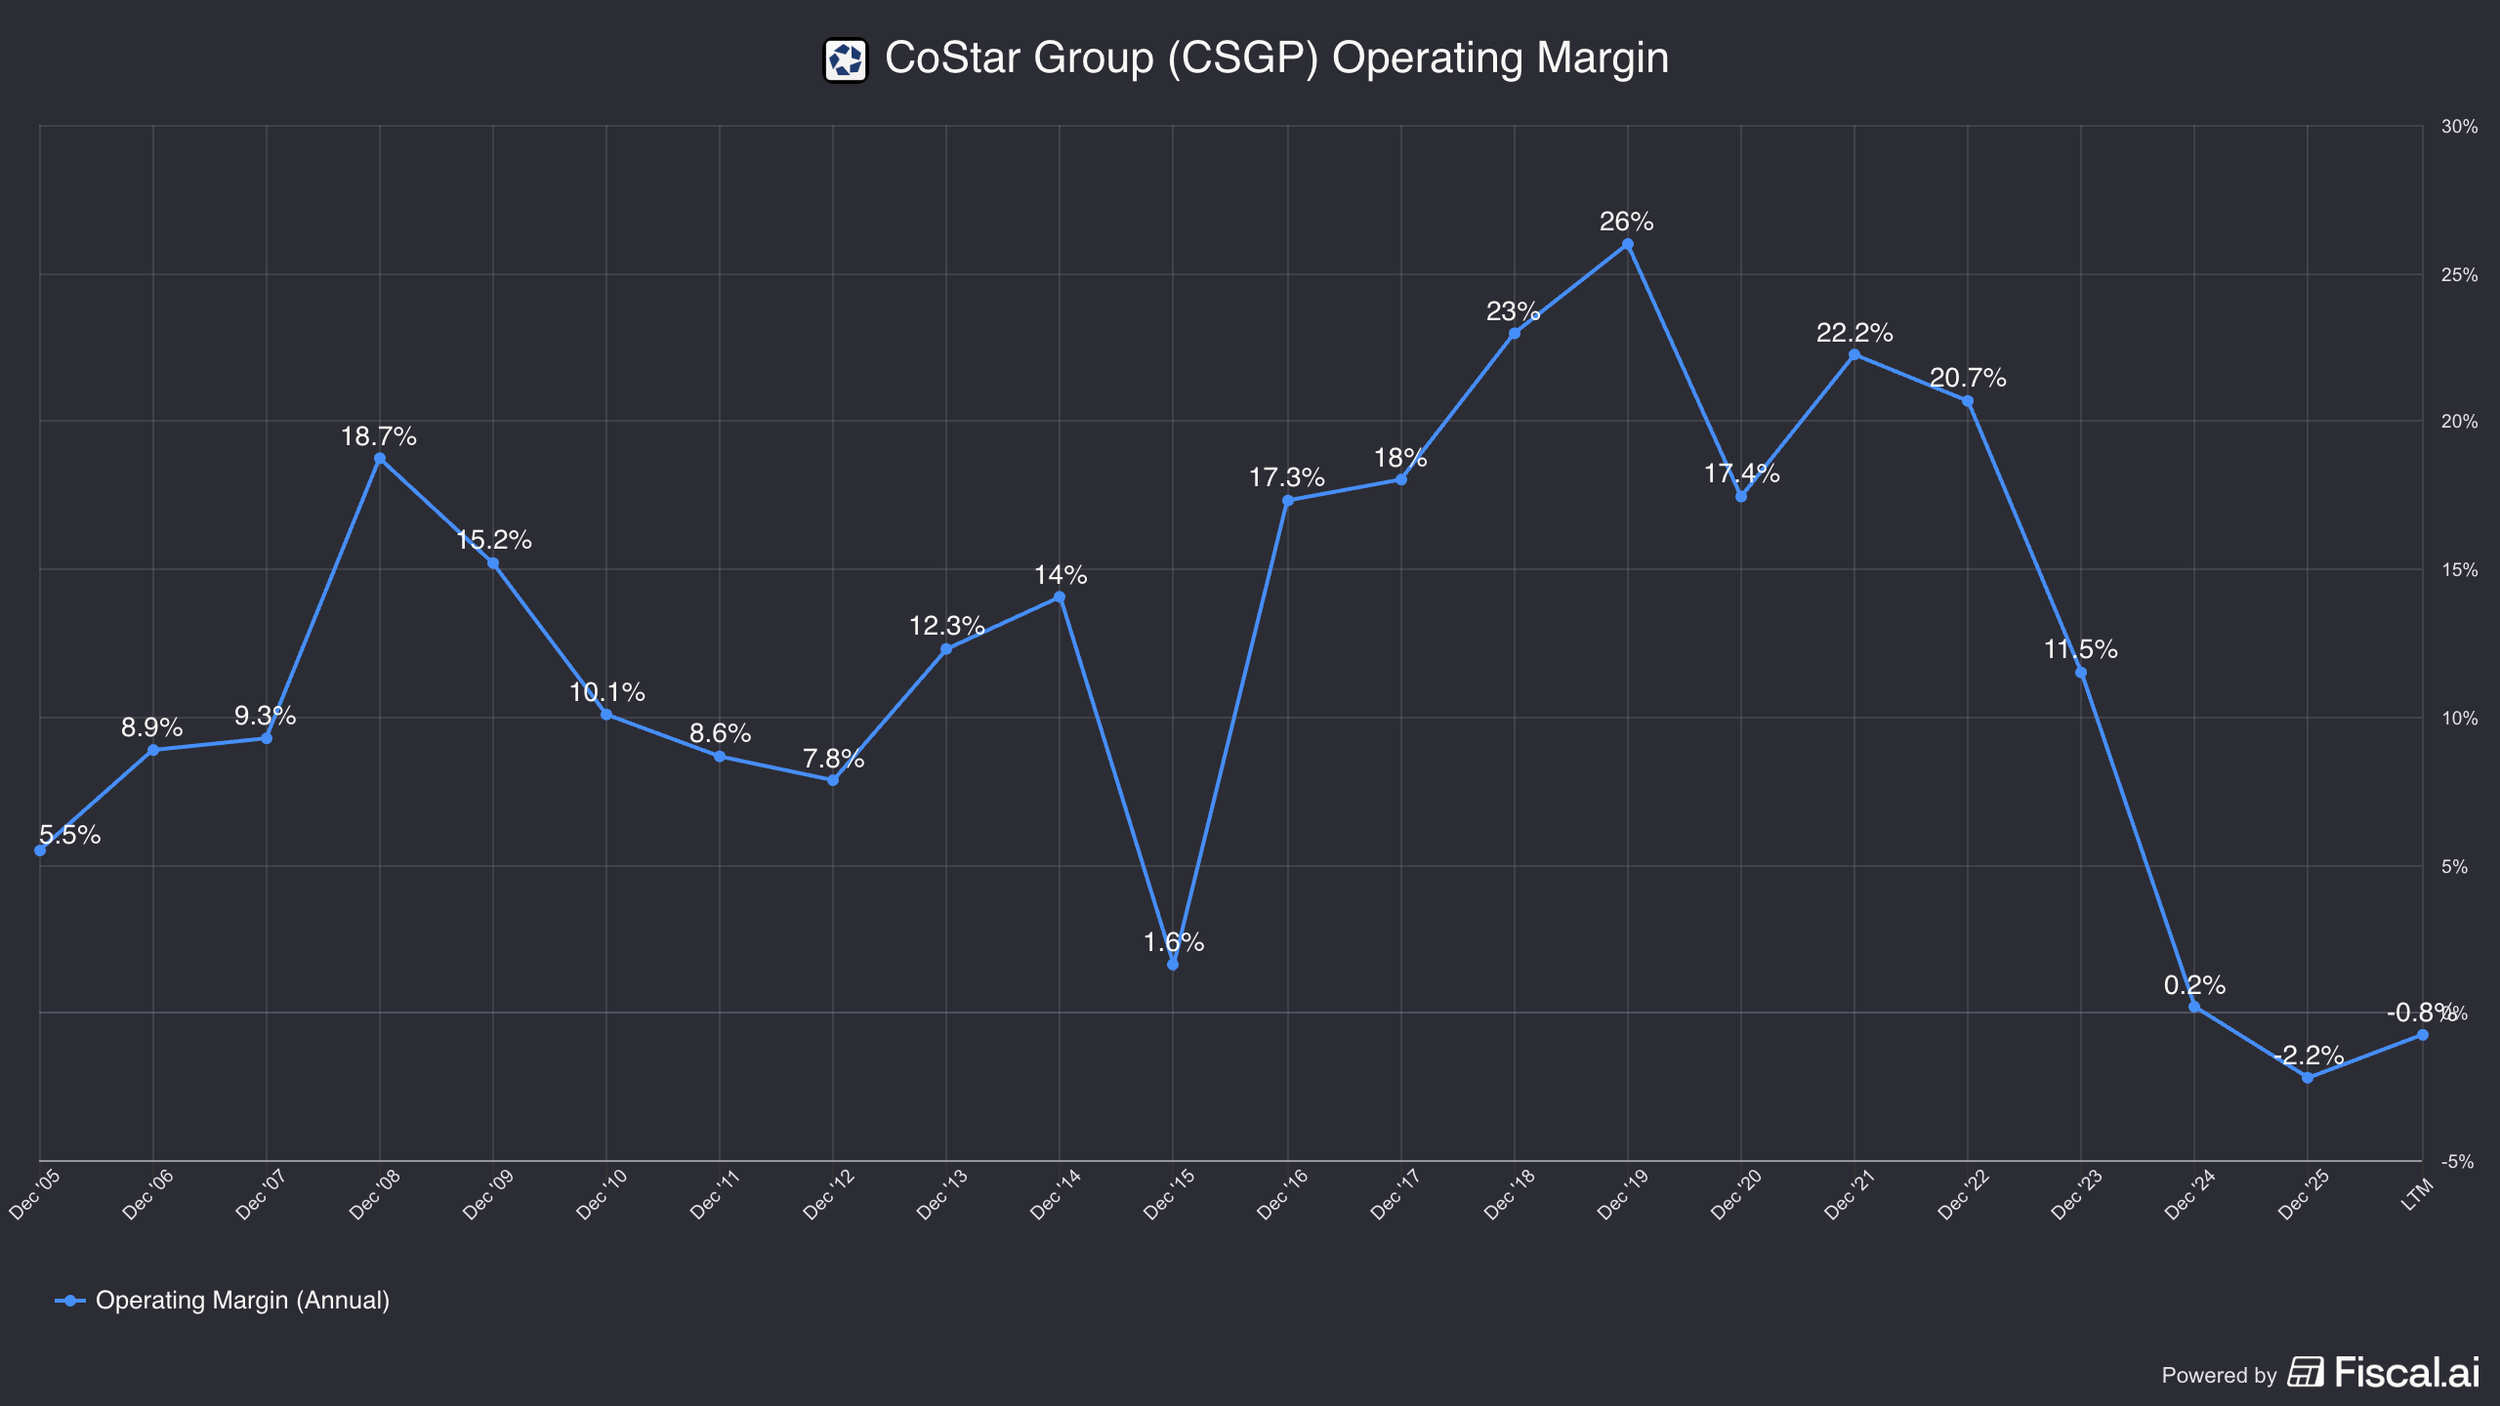
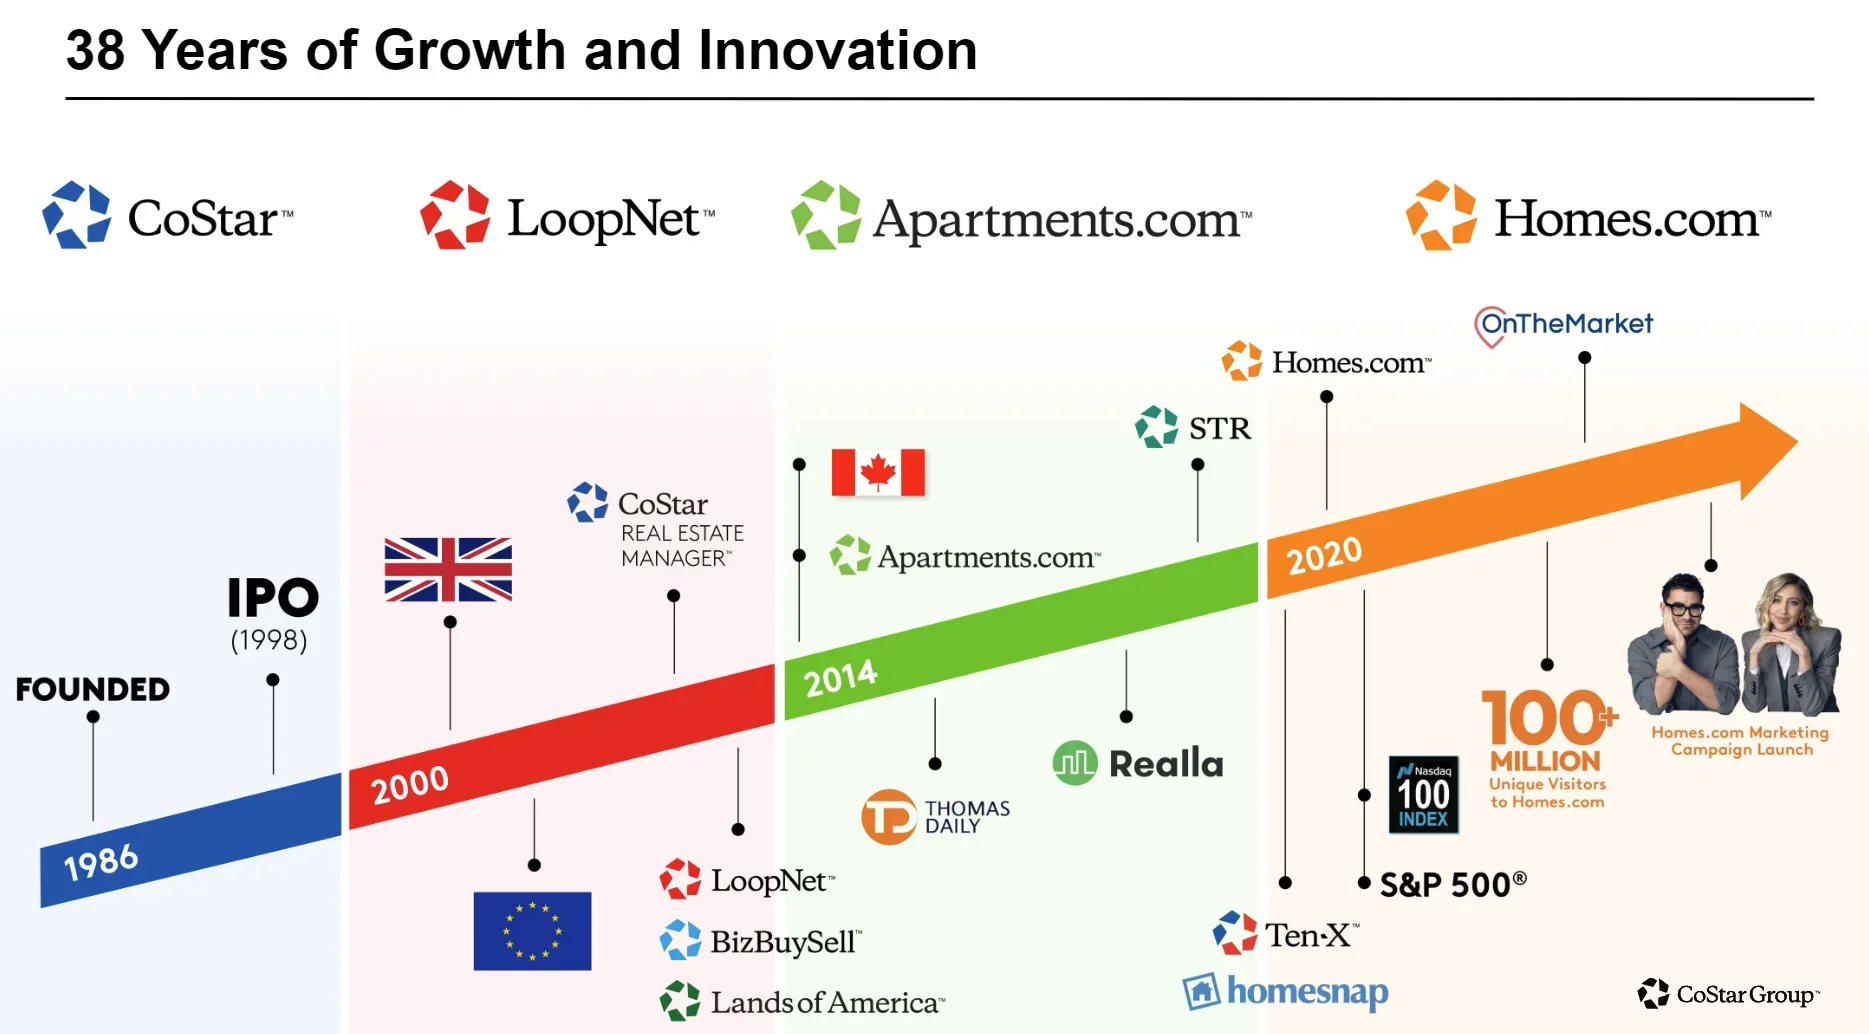
CoStar Group.
CoStar group is a real estate data analytics firm that owns many businesses like apartments.com, homes.com, LoopNet, and BizBuySell.
Their main suite though is called CoStar, which is real estate analytics for professionals in real estate.

They have a lot of data on leasing data, property sales data etc.
It's kind of like Bloomberg just for real estate.

CoStar right now has 0% profit margins, but if you rewind to 2021, they had 22% profit margins.
What has happened in the past few years is they bought homes.com and they've been aggressively investing into it.
They are spending ~$1billion on advertising and that took S&M as a percent of revenue from 32% in 2021 to 47% today.
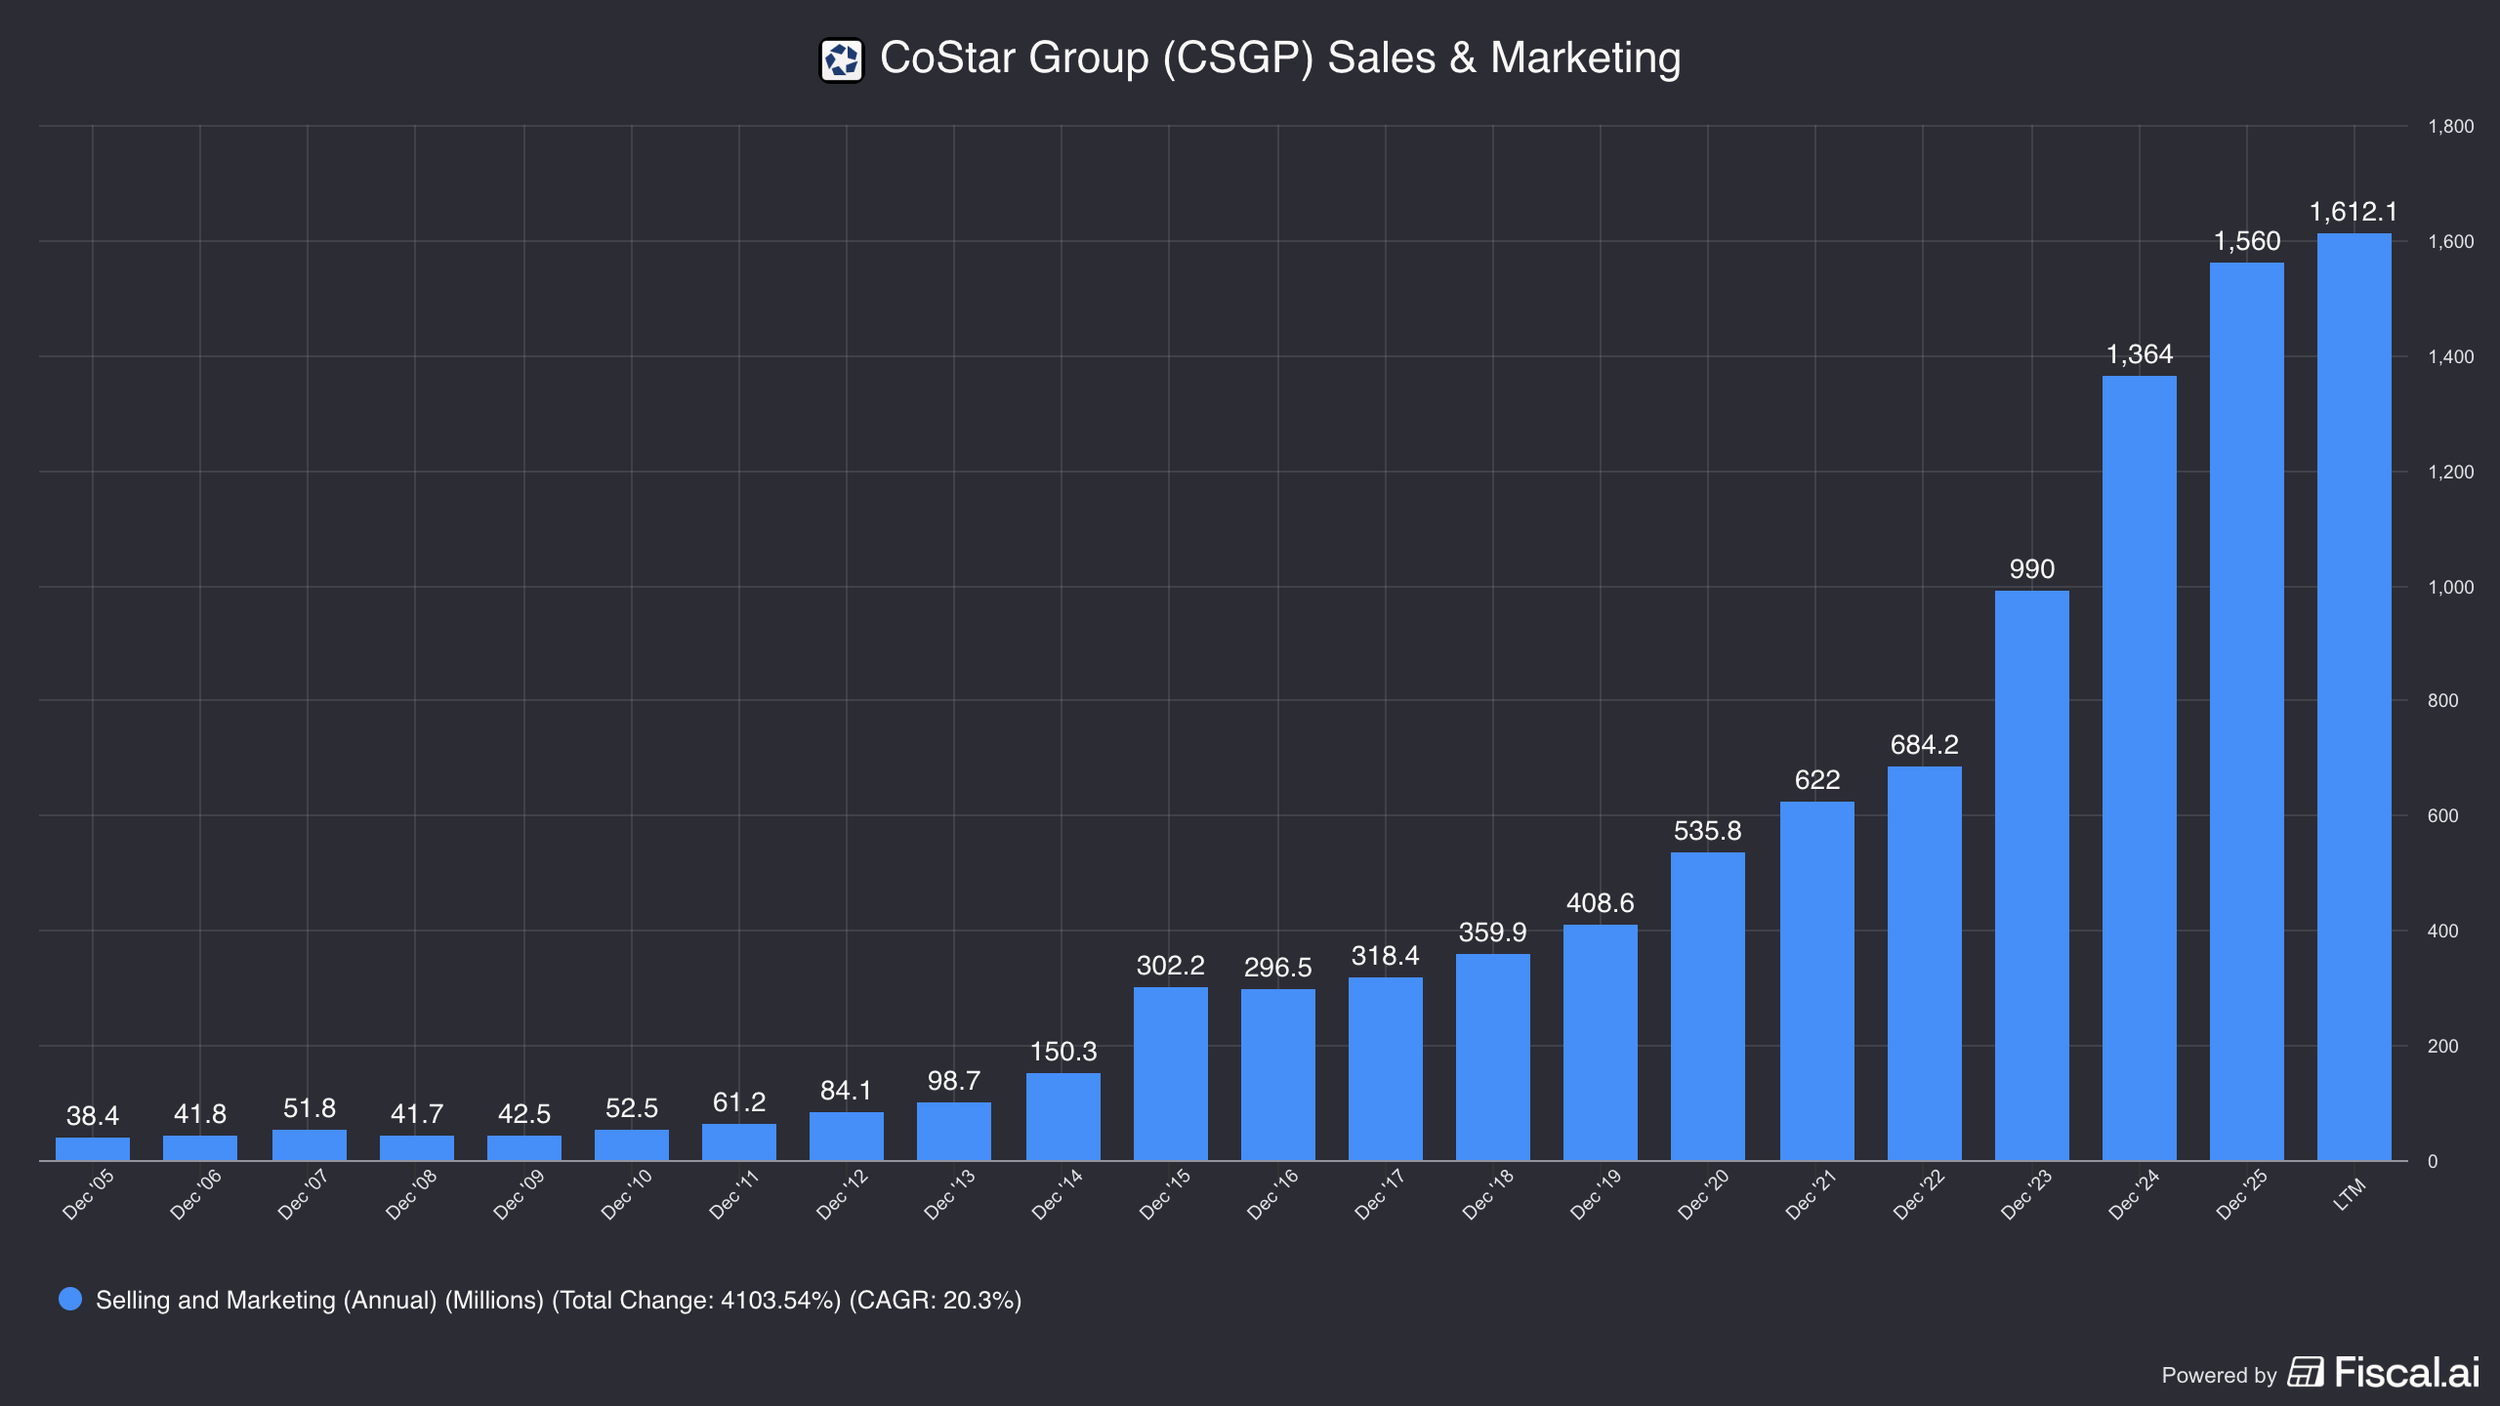
That's 15 points of margin that's gone up on a larger revenue base.
Usually you would see S&M leverage, which means as a company has more and more revenues, the expense line item as a percent of those revenues falls instead, we're seeing the opposite.
So the question as to why this is, is because they are investing a lot in homes.com, they're spending over a billion dollars advertising for this home residential platform to try to overtake Zillow.
Now, if you're an investor though in this business, the question you asking yourself is “How am I going to value it?”
You don’t want value it at 0% margins because they were just doing 22% before.
Is CEO Andy Florence going to just continue to spend this money forever?
Well, that would certainly be crazy if he did.
The way to think about it is that either it works or it doesn’t.
Either the homes.com advertising expense works, they get a big platform out of it, or it doesn't and they start turning down the brand advertising because it was a failure.
Either way, there's still a lot of other businesses within here that are a lot more profitable, that are kind of being hidden in terms of the profitability because of how much money is being directed to homes.com.
So you could think about at maturity when you're not spending all of this money, what does this margin structure look like?
Well, Andy Florence talked about how their core data analytics and marketplace platforms have about 47% plus EBITDA margins.
But comparing that number, 47% for their core marketplaces, clearly they should be running a lot higher margin than they are today.
So do you want to put a 40-45% margin on that?
Probably not.
30% margin seem to be a fair comfortable margin to value that business at.
Different investors are going to have different opinions on that, and you could take a range and sensitize around it as well.
The big thing is that you have this proof point that they were able to generate higher margins in the past, right?
Because you would've seen in 2021, they did 22% EBIT margins, which is part of the reason why I think it's really important to look at a long history of financial data.
When applying the mature margin framework, you also want to look at a peer company that is at maturity and their cost structure so you can understand what you think a business could look like when they were reach maturity.
When we researched Mercado Libre and was doing analysis on Mercado Pago, we looked at NuBank to get a sense on what pre-tax margins can look like.

You do have to be careful if there's like idiosyncrasies with different geographies or different business lines.
Mature Margin Warning.
Mature margins are in a sense theoretical.
If you're using a mature margin framework for an early stage growth company that is not profitable, there's no valuation downside.
If your mature margins are wrong, or even if you're right, but it's going to take many, many years, there's nothing to protect the downside.
If you were an investor in Sea Limited in 2021/2022 and you said, “I think the e-commerce operations can be able to make 1-2% EBIT as a percent of GM, the stock fell 90%.
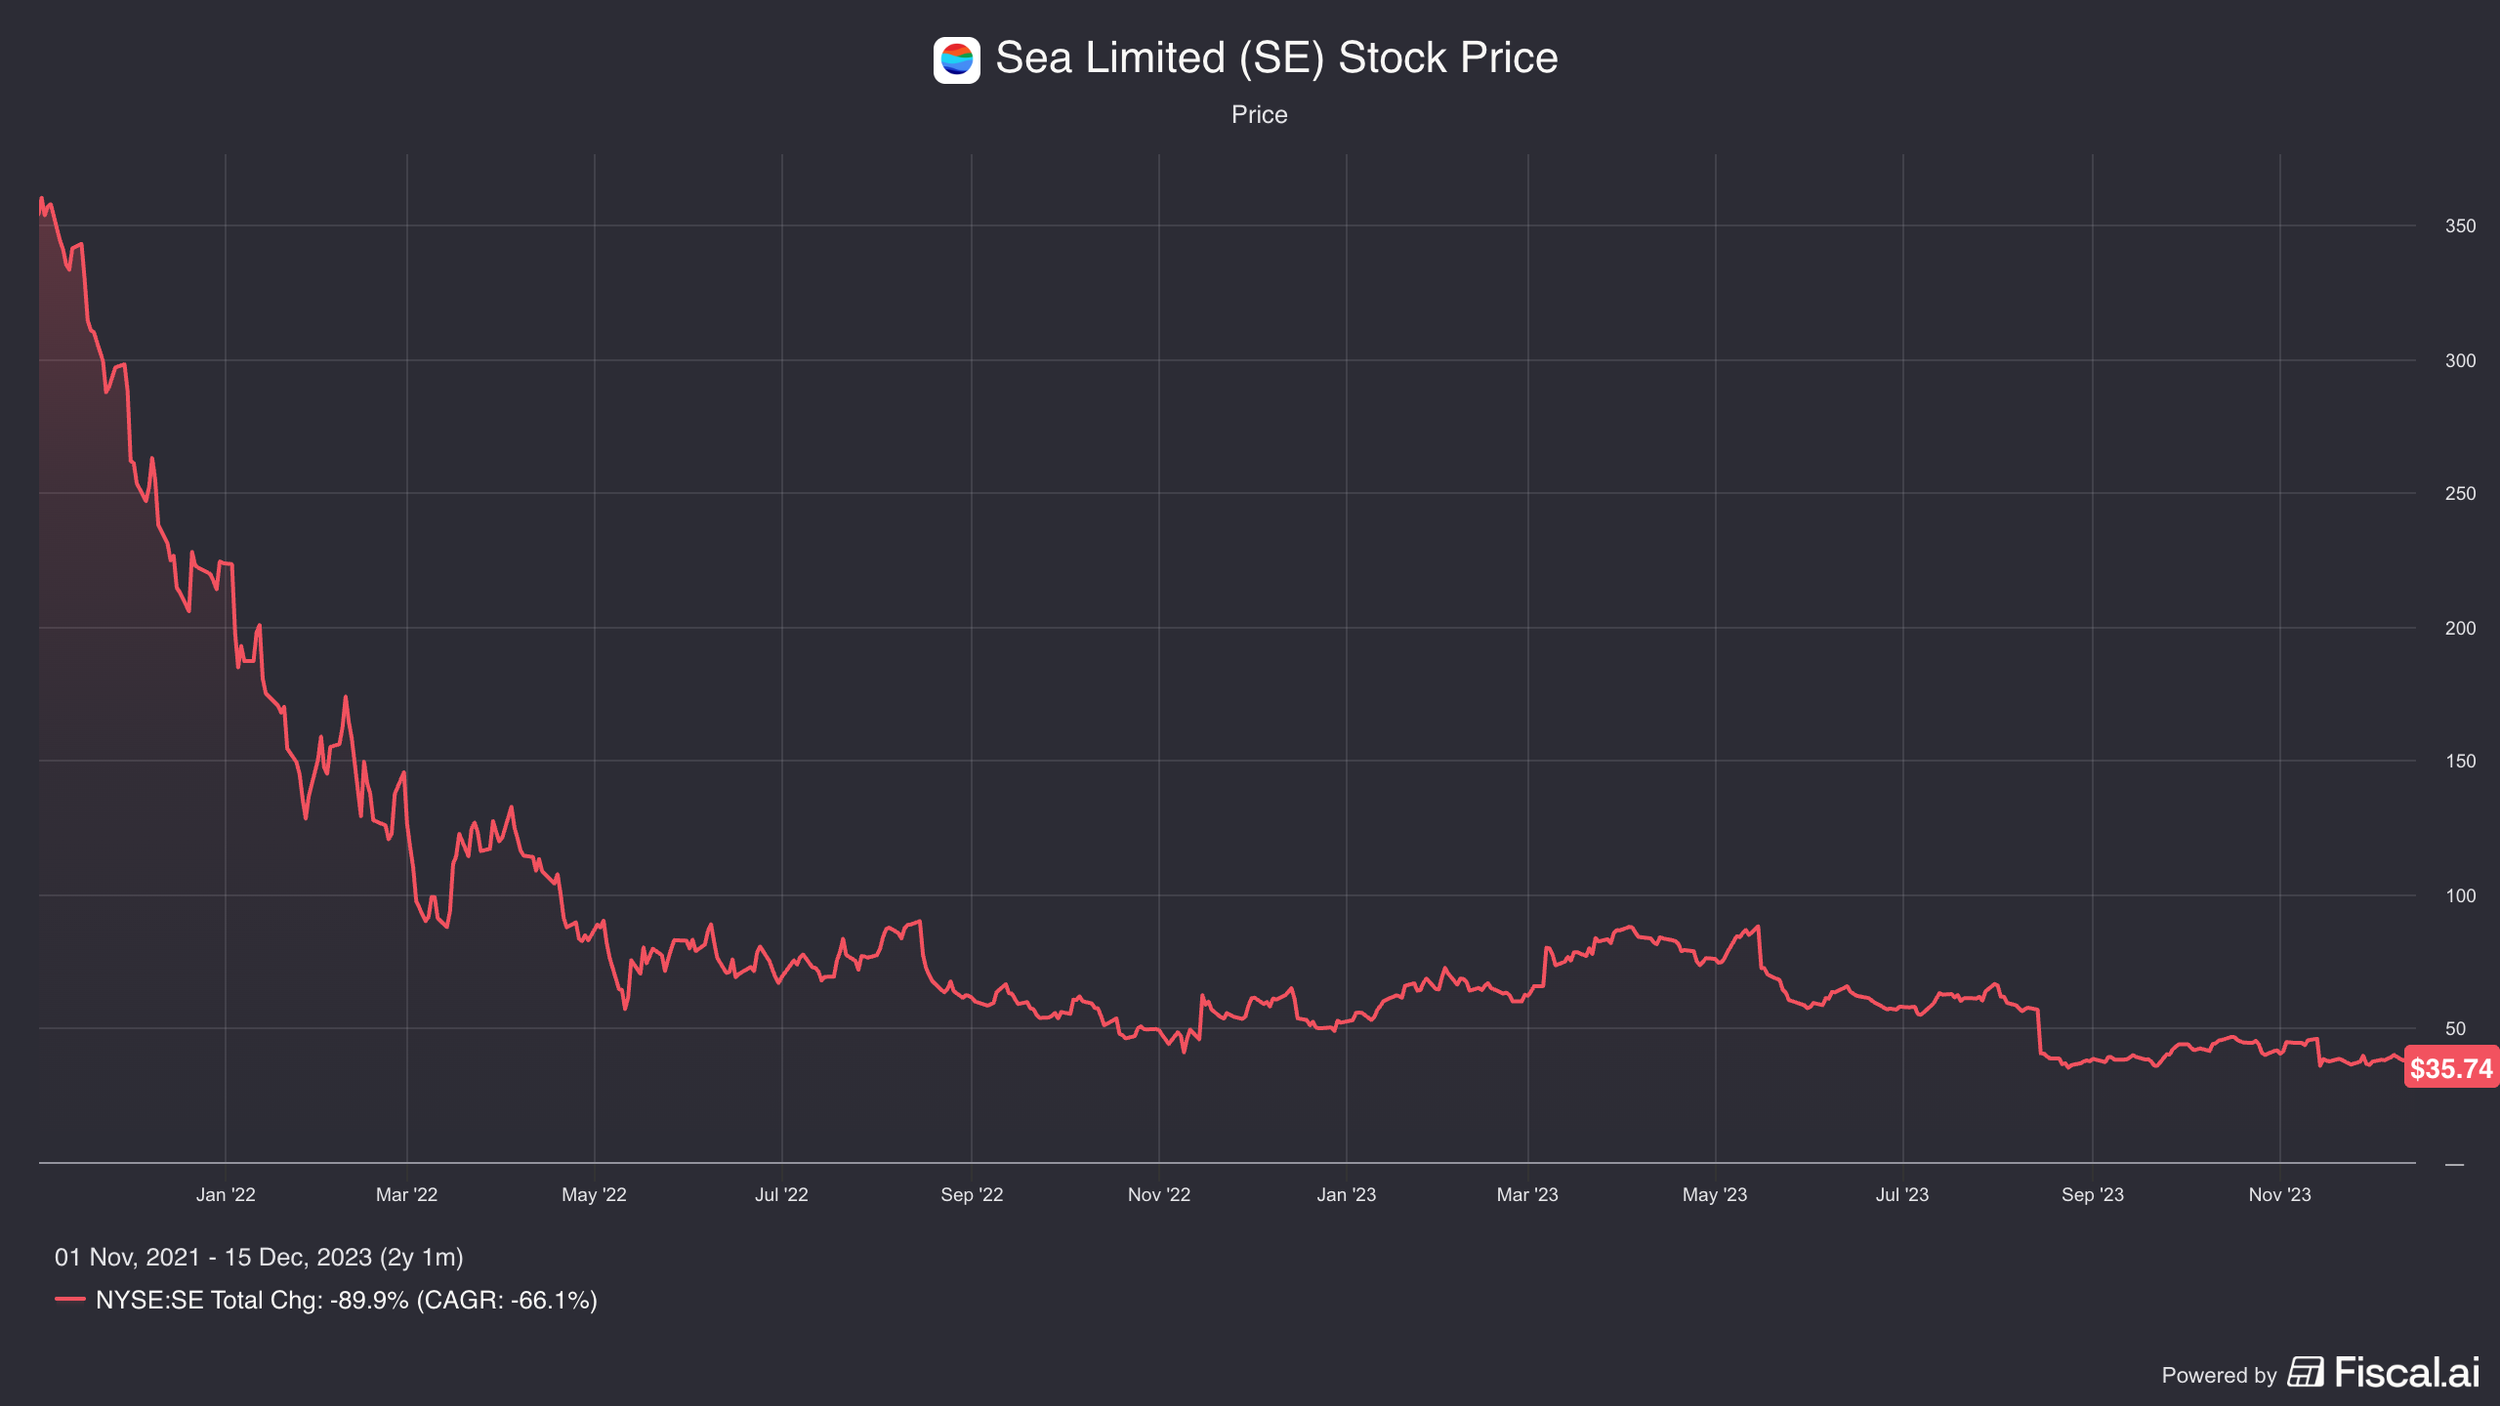
And even though you could have still been confident in your mature margins assumptions until the company produces real earnings and cash flows, there's just no valuation protection downside to it.
That's not exactly a long-term investment risk but let's be honest here, no one wants to endure a large drawdown if they can avoid it.
This also brings into question when a company does undergo a large drawdown like that, maybe your mature margins were wrong and how much confidence are you really going to have to hold through them through that sort of drawdown?
While they are still theoretical I do still think valuing a business using the mature margin framework is a better way to value a business so that we can understand what the real underlying economics of the business really are and can value those real earnings in a clean way.
In the end, valuing unprofitable companies is less about precision and more about building a logical framework for understanding what the business could become.
Traditional metrics like PE ratios often fail because they only capture what a company earns today, not what it could earn once scale, operating leverage, and market position mature.
That is why frameworks like Fermi Problems and the Mature Margin Framework matter so much for growth investing.
Fermi Problems force you to break massive opportunities into smaller, understandable pieces.
Instead of asking, “What is Waymo worth in 15 years?” you ask:
How large is the market?
What share could they realistically capture?
What are the unit economics?
What does the cost structure look like at scale?
And ultimately, what earnings power could emerge over time?
The Mature Margin Framework then helps bridge the gap between today’s reported financials and the long-term economics of the business.
Many growth companies intentionally suppress current profits because they are aggressively reinvesting into customer acquisition, R&D, and expansion.
Looking only at current margins can dramatically understate the true earnings potential of the business.
At the same time, both frameworks require humility.
Small changes in assumptions can produce enormous swings in valuation outcomes.
Mature margins are theoretical. TAM estimates can be wrong. Competitive dynamics can shift.
Even if your long-term thesis is ultimately correct, markets can still punish stocks severely in the short run.
Ultimately, investing in growth companies is an exercise in probabilistic thinking.
You are not trying to predict the future with certainty, you are trying to build a reasonable framework for what the future could look like and compare that against the expectations already embedded in the stock price.
The investors who do this well are ones who can think clearly about business economics, competitive advantages, reinvestment opportunities, and long-term earnings power before those numbers fully appear in reported profits.
For more on how taxes can affect your investing decision process, check out the video below.
Nothing in this newsletter is investment advice nor should be construed as such. Contributors to the newsletter may own securities discussed. Furthermore, accounts contributors advise on may also have positions in companies discussed. Please see our full disclaimers here.